

Sometimes you get an idea that you want to explore and you propose a presentation topic on it – and it gets accepted. Well, maybe that doesn’t happen to you but I do it occasionally. It allows me to test what folks are interested in. In this case, I had submitted a session called “Delving into SharePoint Search in the Cloud”. It was designed to cover how the way that we find information is shifting from search to social. It was designed to show how push vs. pull can work.
I realized that, while I had a good understanding of social networks, I didn’t have a great understanding, and I wanted to deepen my thinking before I did a presentation on the topic. Thus I finally settled on Analyzing the Social Web as my primer. It was a good choice.
What is Delve?
In understanding the connection between social web and search, you should first understand what Delve is and how it grew. The short form of the story is that Delve is the visual interface on a social web called the Office Graph. The Office Graph tracks people and objects like Word documents, Excel documents, etc., and it tracks the relationships between people and objects. It does this by watching your actions in the background as you email people and as you store documents in Office 365.
The Office Graph learns about you and the relationships, and can then surface the objects related to you, such as the Word document your colleague just finished working on and the presentation that your president just gave to the organization. In the Delve interface, these are surfaced as a newsfeed so you can discover what is happening around you instead of trying to locate it yourself.

Improving Relevance
Delve and the Office Graph grew up in the land of search. The SharePoint search team, many of whom worked for FAST Search before their acquisition, own the Office Graph and Delve. This ownership makes sense when you consider that having a social awareness of people can help drive relevance of search results as well.
Search, without links, can only get so good. The major leap in search technology was the recognition that the articles that are linked to the most are the ones that are generally the most relevant. This idea has made Google billions of dollars. However, on an intranet, the quantity of content that is cross-linked is very low. It’s not typical to find the kind of linking and density that you’ll find in the public Internet.
Intranet search can substitute relationships for explicit links between content and use that to drive greater relevance of documents. It solves a lot of ancillary problems as well, like the problem of newer content not being surfaced as often because it has fewer links.
Content Curation
Ultimately the result of this new social + search approach may be that our need for content curation is reduced. While I believe we’ll always need information architects to drive the structure for the content, it can be that we’ll need fewer librarians to manage the content into that structure. Between automatic classification tools, search tools, and social networks layered into it, it’s possible that we can reduce our dependence on organizational librarians.
The good news is that we already eliminated the corporate librarians in the 1990s, so we don’t have to let anyone go. Instead, perhaps we’ll decide to hire a few back to help everyone understand how to use the tools and what the value is.
Content curation was done to improve our relevance and to make the right things surface when we needed them. However, it can be that the social graph can take the place of some of that for us.
Graph Basics
One of the starting points for social graphs is to realize the components of the graph. There are nodes: in most cases for a social graph, these are people; but in graphs with multiple objects these could also be documents – as they are in the Office Graph. However, the interesting part of a social graph isn’t the nodes – it is the link between nodes. Links between nodes can have different types, and more importantly the links can have different weights. That is, there are sometimes weak ties and sometimes there are strong ties.
Link Gravity
The amount of connectedness in a link is an area of interest, because people have both strong ties to those like their family and weaker ties to others. (See High Orbit – Respecting Grieving for more about relationship strength.) The strength of these ties and their type help you to understand the relevance of one person’s activity to another person. The closer they are, the more likely that the activity is interesting. It’s also more likely that you’ll trust a recommendation from someone when the connections are close.
Six Degrees of Kevin Bacon
Most folks have heard of a game called “Six Degrees of Kevin Bacon”. It works like this. You try to connect any actor with Kevin Bacon. The idea is that you can connect any actor to Kevin Bacon in six movie hops or less. An actor who was in a movie with Kevin Bacon has a Bacon-number of 1. An actor who was in a movie with one of Kevin Bacon’s co-actors in a movie has a Bacon-number of 2 and so on as we go through the various actors that have acted with the people who have acted with Kevin Bacon.
This is a variation on the relation to a prolific mathematician called Paul Erdos, and thus the game was played as the Erdos number – how close based on publications every other mathematician was. However, even further back, this goes to some research that Stanley Milgram did where he sent off letters with instructions for the receiver to try to get to a specific target person. The average number of jumps between people was about six. This is the genesis of the small world paradigm.
Small World
It’s popular to say today that we live in a small world. We can quite literally video chat with someone on the other side of the planet as us – as I do when I get to speak with my friend Paul Culmsee. No longer are our communications time delayed by the need for atoms to be carried across the globe. We have electrons, photons, and radio waves that make communication across large distances both quick and cheap. However, this isn’t the original intent of the small world idea. The original idea isn’t that we can communicate but that we’re connected.
The idea is that we are connected through a relatively small number of connections to nearly every human being on the planet. In 2011, Facebook members were an average distance of 4.74 hops apart. It’s not that our communications are getting faster, cheaper and more accessible – which they are – but instead the point is that people are connecting more frequently than they used to.
Weak Links
Granovetter published his research about how out-of-work men found jobs. It’s no secret that many jobs are never listed anywhere, and that in knowing someone, you can find the job you’re looking for or you need. What wasn’t well understood was that it’s the power of weak connections that are the most valuable. When the ties are strong, the social circles close in, and it’s unlikely that someone in your close social circle knows someone that you don’t – and thus they’re not valuable when you’re seeking a job.
However, folks with whom you have weak ties – people where your worlds intersect but aren’t enmeshed – are the most valuable. Hackman talks about the challenge of teams with tight relationships in Collaborative Intelligence in terms of overbounded teams – that is, they’re difficult to penetrate into and tend to be insular.
When you expand your network and increase the number of weak ties you have, you increase the possibilities. You create your own Medici effect which sparked the Renaissance. (See The Medici Effect for more.) You also create a greater chance of innovation.
Network Analysis
The point of network analysis is to be able to gain some meaningful insights in the data. The point is to be able to help the people in the network connect better, get better information, or for the developer to be able to leverage information. We’ve all used the recommendation engines on Amazon, Netflix, Facebook, LinkedIn, etc., when they’ve pushed products or people to us that they believe we want, will like or know.
There are many ways that network analysis can lead to insights.
Forbidden Triads
One of the most basic and interesting social network patterns is identification of “forbidden triads”. This is the name that Granovetter gave the situation when two people should know each other but don’t. In this case, the question becomes why not? In Granovetter’s studies, it may have been because it was a wife and a mistress who, despite both having a close connection with a man, probably shouldn’t meet. (That is unless you’re Jung or Murray – more about that in The Cult of Personality Testing.) In today’s social networking, when a person knows two others closely but they don’t appear to know each other, it’s a good opportunity for a friend suggestion.
The Strength of Relationships
One of the key challenges in building a network is in judging the strength of relationships. There are some mathematical solutions which can be used to mitigate the potential errors in the strength of the relationships. In particular:
- Jaccard Index – Counts the total number of friends in common and divides that by the total number of friends of either node.
- Adamic & Adar – Increase the weight of common friends with fewer friends to reduce the influence of celebrities.
These tools allow the network to greater predict the impact of one person on another by more closely modeling the way that humans behave. These are just two published approaches for assessing the relative strength or importance of a relationship. Machine learning approaches are also now being used which lead to – hopefully – even more accurate prediction of behavior based on the information in the graph.
Too Big to Analyze
In truth, the tools for analyzing a social graph are tools for analyzing a portion of the graph. In most cases, we’re establishing an egocentric graph from the overall graph and assessing the network from the point of view of a single professional. That is necessary because processing the entire network to evaluate all the possibilities is greater than is generally feasible. In other words, social networks of any size are too big to be fully processed.
Egocentric views of the graph give us a way to restrict the processing in ways that allow for problems that can be solved inside the limits of the computational resources we have available.
Building A Graph
If it’s not become apparent yet, building a graph of relationships between people can be a time-consuming process. People spend years collecting Facebook friends and even longer cultivating LinkedIn connections. This is a non-trivial amount of effort that people will do only when they can see the value. The challenge in this case is to build a graph that quickly develops meaning to its users.
While some public sites have reached saturation – like Facebook and LinkedIn – many more have failed to get enough people putting in enough data to make the social engine start to run effectively. So, it’s important as designers are building new social networks that they make the process of connecting as frictionless as possible.
Frictionless Sharing
Mark Zuckerberg described the process that Facebook uses to power its graph as “frictionless sharing”. It’s more like frictionless signaling. When a user reads a post, that’s a signal. When a user likes a post, that’s a stronger signal. When they share a post, that’s an even stronger signal. These signals indicate the level to which a user likes the content of another.
So, the more action that the user must take, the stronger the signal; however, most of the actions in the network are of the frictionless variety. They are recorded without the user taking a specific action.
Ultimately these signals are converted into relationships – or links. The process for converting signals to links is proprietary but very powerful.
Please Rob Me
Not every use for social networking is a positive one. Building on the Foursquare application’s ability to post to Twitter, and the belief that Twitter account owners could be identified to their house or location, the site Please Rob Me offered information about anyone who wasn’t home so that thieves could burglarize their place. There aren’t documented situations where the site was used for this purpose – but it did create awareness of concern for what we’re sharing.
Many photos taken by cell phones have the GPS data embedded in them – data that can be used to either identify a home address if the person was taking a picture of their new flowers, or that they’re away from home as they take a picture in a scenic national park. The potential to use this data for nefarious activities is a very real risk to the growing sophistication of social networks.
Picture This
One of my favorite things that has now been turned off is a feature that allowed you to map your LinkedIn connections. He’s what my network looked like back in 2012. This visualization allowed me to put clusters into groups and I got to see how my groups overlapped. When this was created, I was already more than 10 years into SharePoint so that part of my network is large. It’s not surprising that Microsoft (the maker of SharePoint) is another large block of people. The other groups represent clients or other areas that I spent a lot of time.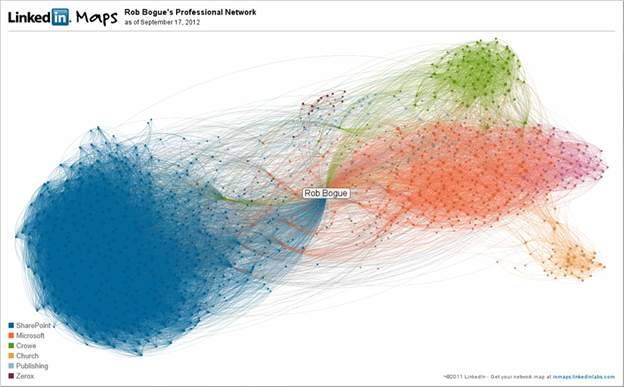
One could quite successfully argue that this doesn’t mean anything and it doesn’t change any behavior (the marker I use with clients for key performance indicators). I will say that when I created it, I was surprised to see that the SharePoint cloud was larger than pretty much all the others. Similarly, I was surprised at how many disconnected people were connected between the groups.
Hopefully, as our experience with social graphs improves, we’ll find better ways to find insight out of these graphs, and more importantly better ways to go about Analyzing the Social Web.
No comment yet, add your voice below!